System Info
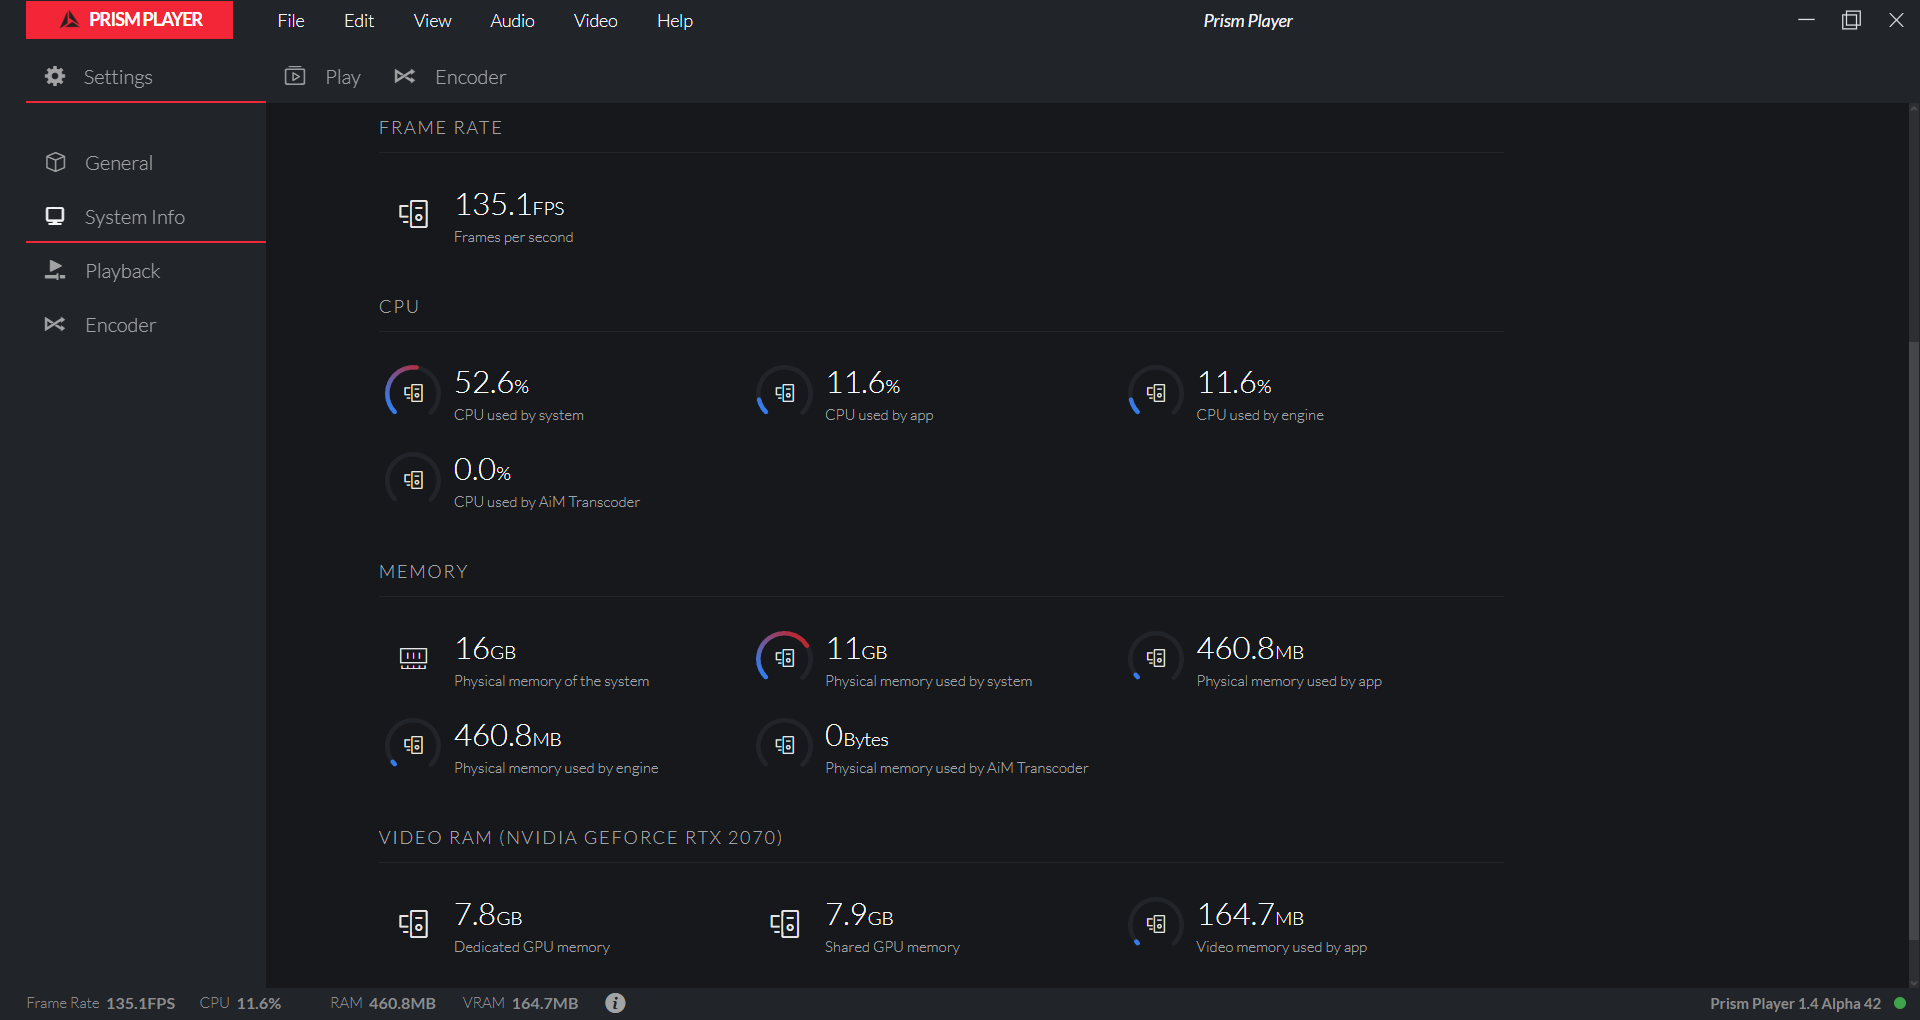
This page shows general system information and performance metrics of the system and the application.
App specific performance metrics are also displayed in the status bar at the bottom of the application UI.
| Item | Description |
|---|---|
| Connected Hard Drive | This section shows the hard drives connected to the system. For each hard drive the total storage space, the used space and the available space are displayed. |
| Frame Rate | This section shows the rate at which the app is displaying video frames. |
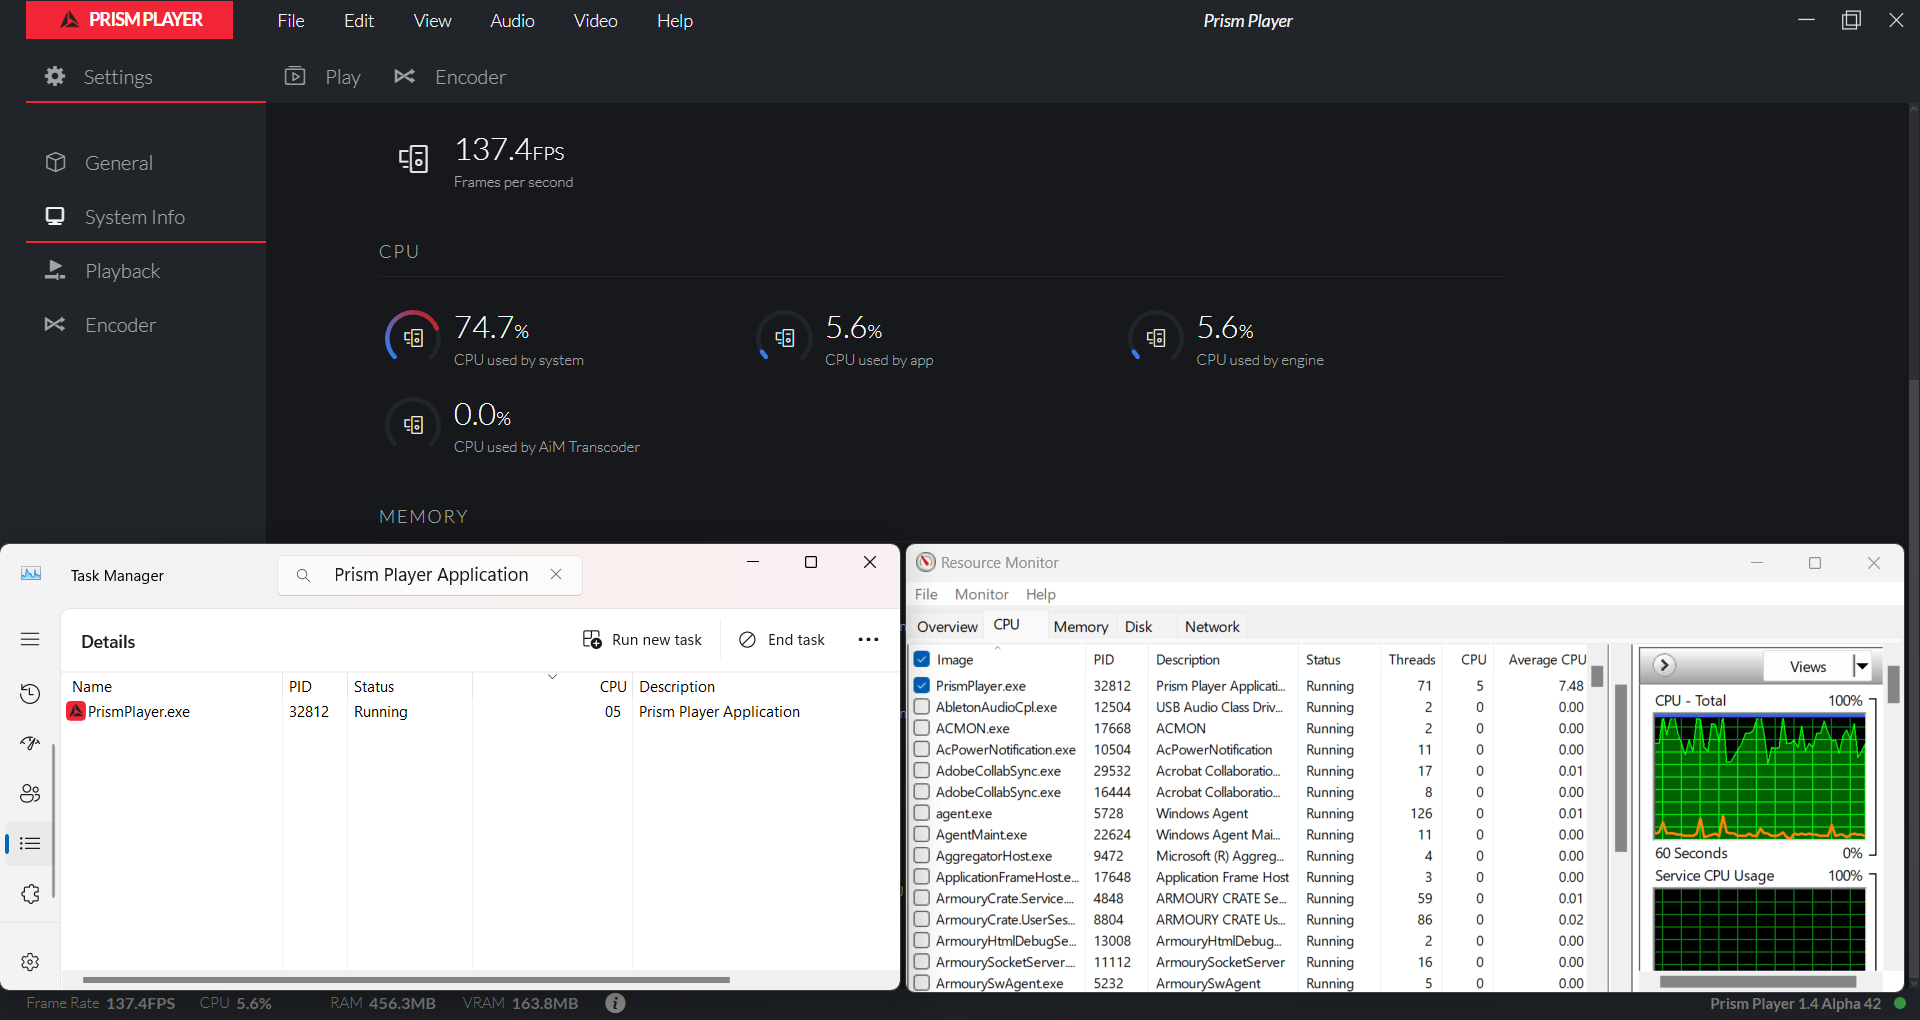
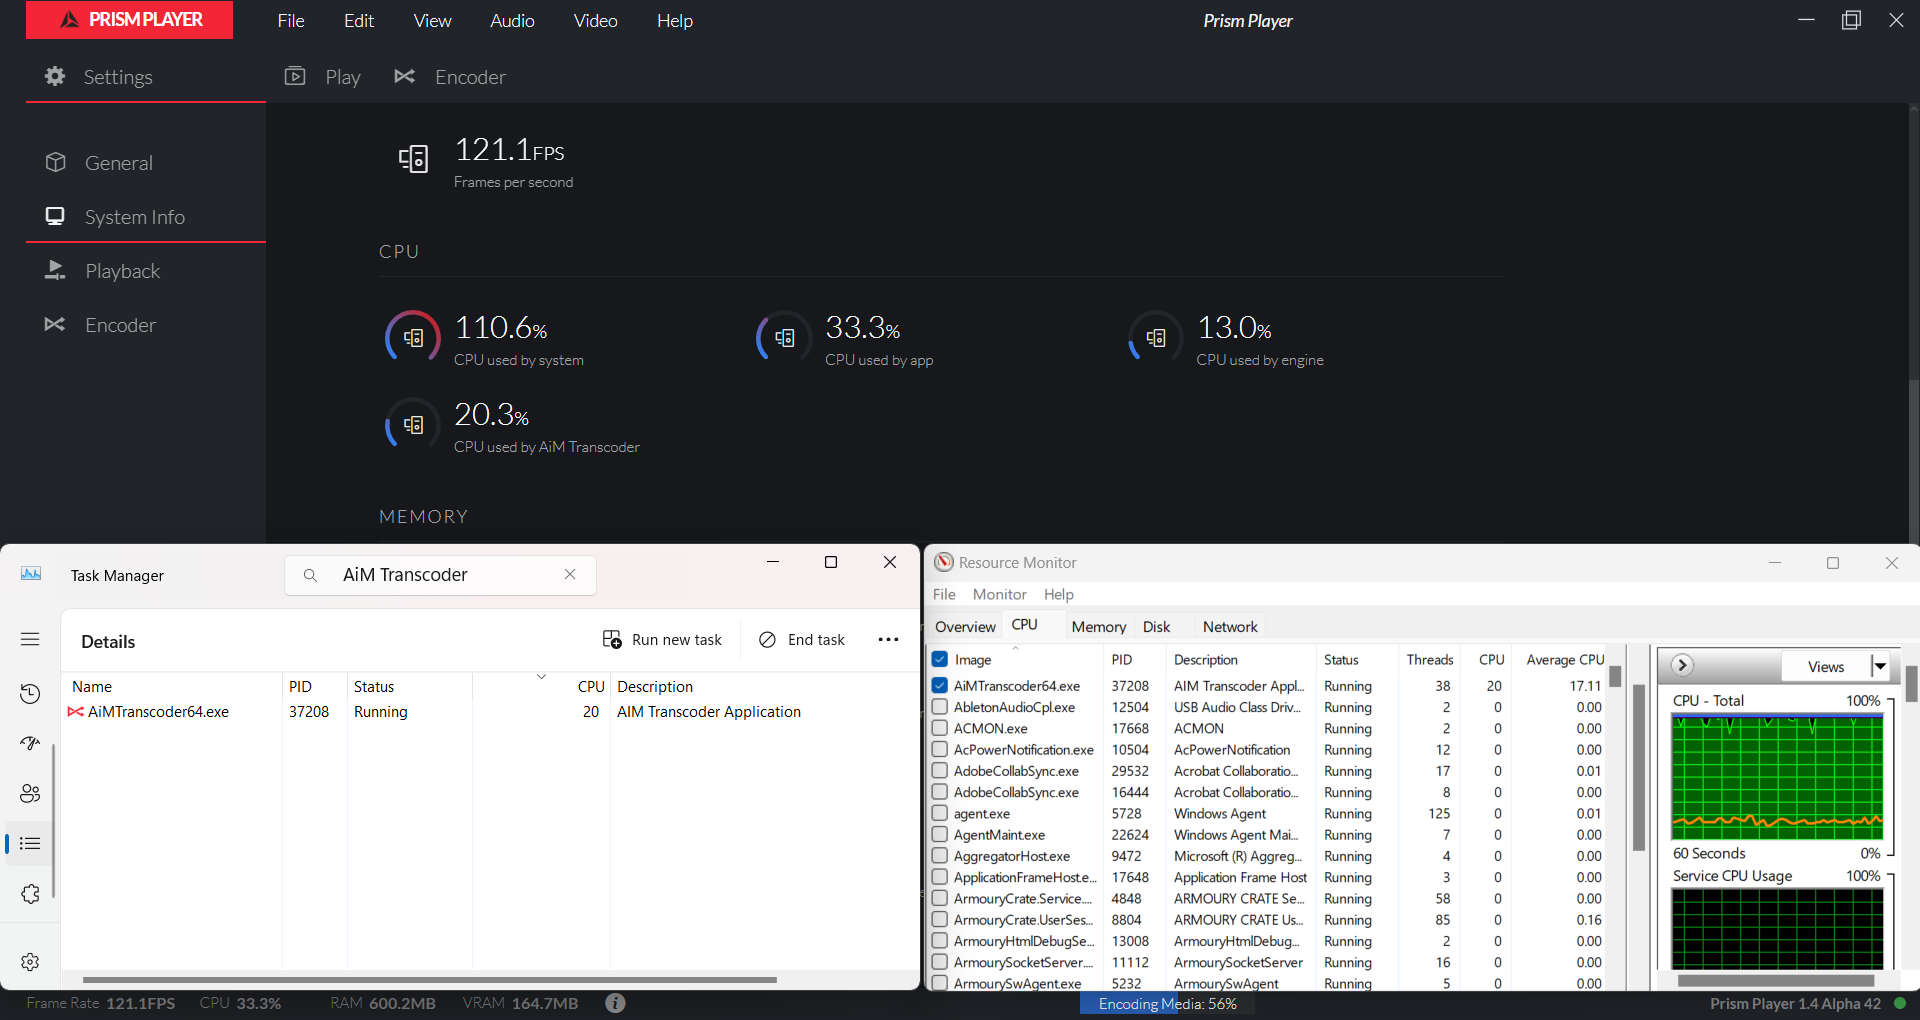
| CPU | This section shows the overall system CPU load and the app CPU load. Furthermore, it shows the engine process CPU load and the AiM Transcoder process CPU load. The app CPU load is the sum of these two values. |
| Memory | This section displays the total system memory available, the memory used by the app, and the overall system memory usage. It also breaks down memory usage by the engine process and the AiM Transcoder process. The app’s total memory usage is the sum of the memory used by these two processes. |
| Video RAM | This section shows the total amount of Dedicated and Shared VRAM available for the selected GPU and the amount in use by the app. |
CPU
System CPU load is the last obtained value (not an average value), and it is comparable to the Total processor utilisation across all cores percentage value shown in Task Manager's Processes tab header - CPU column, in absolute %.
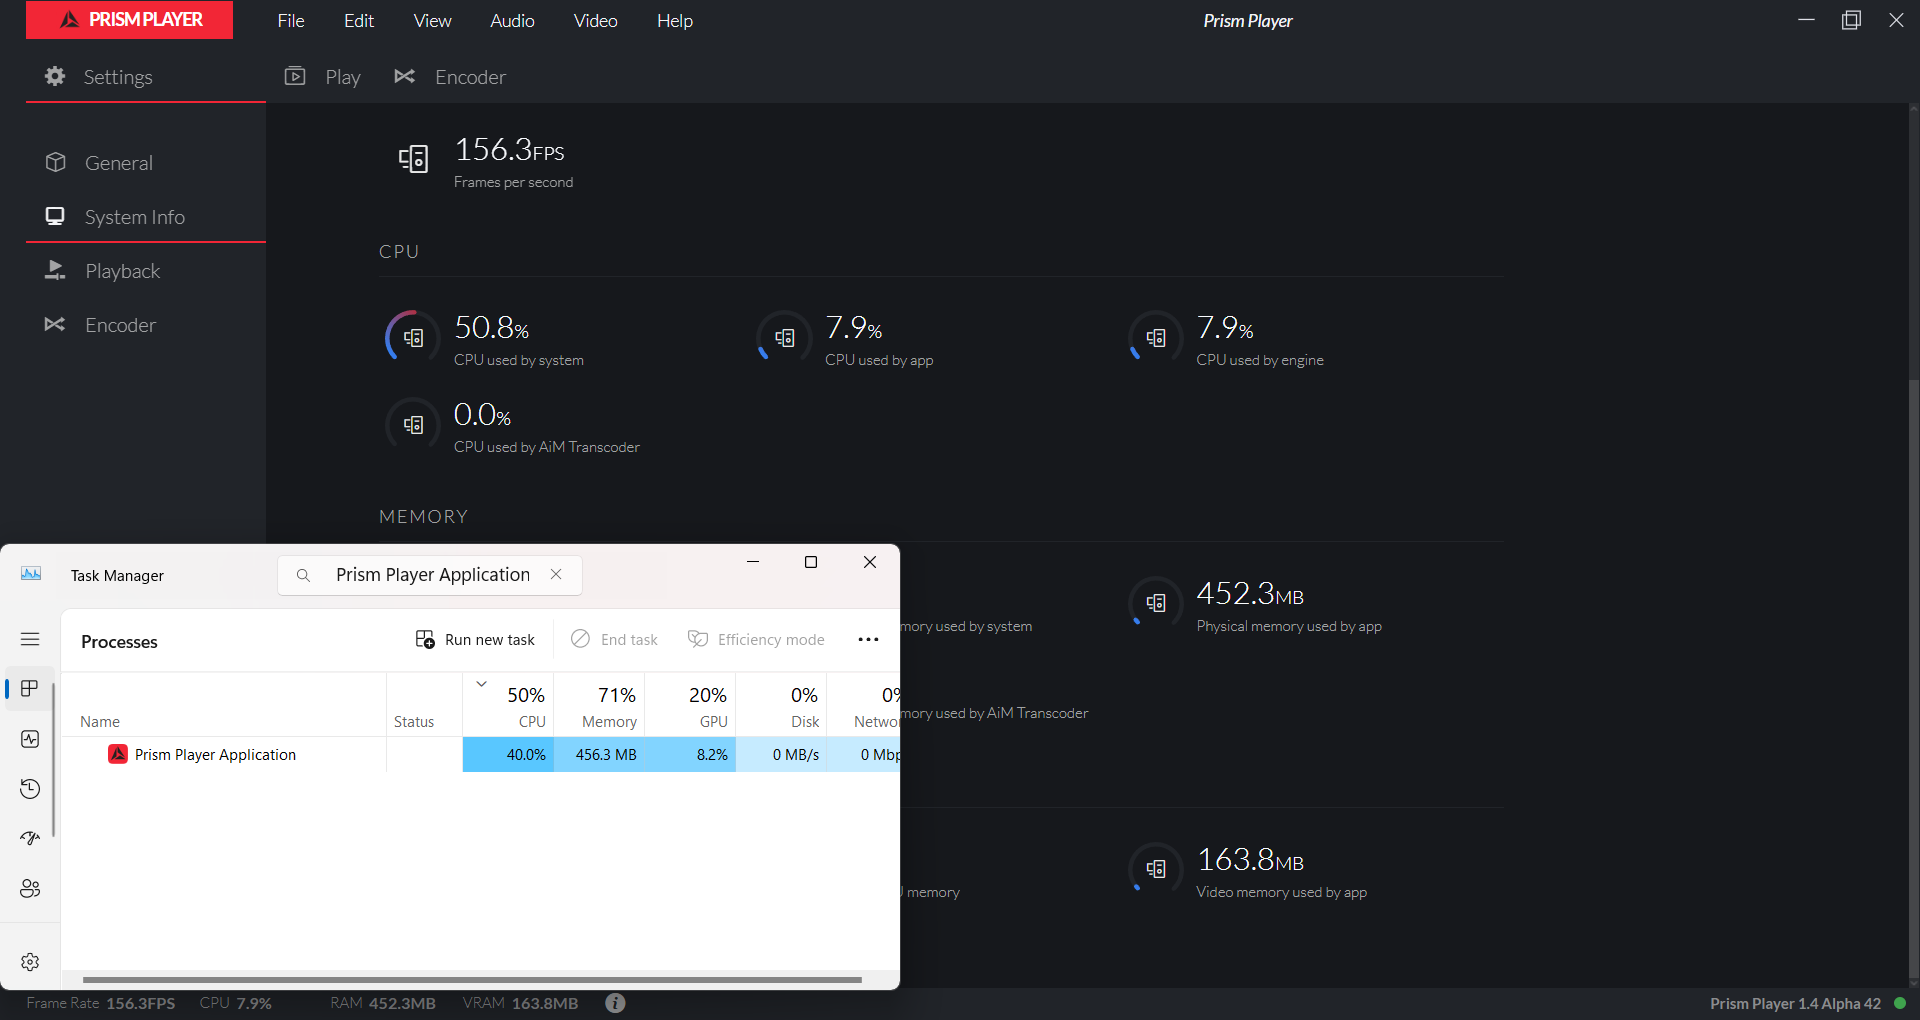
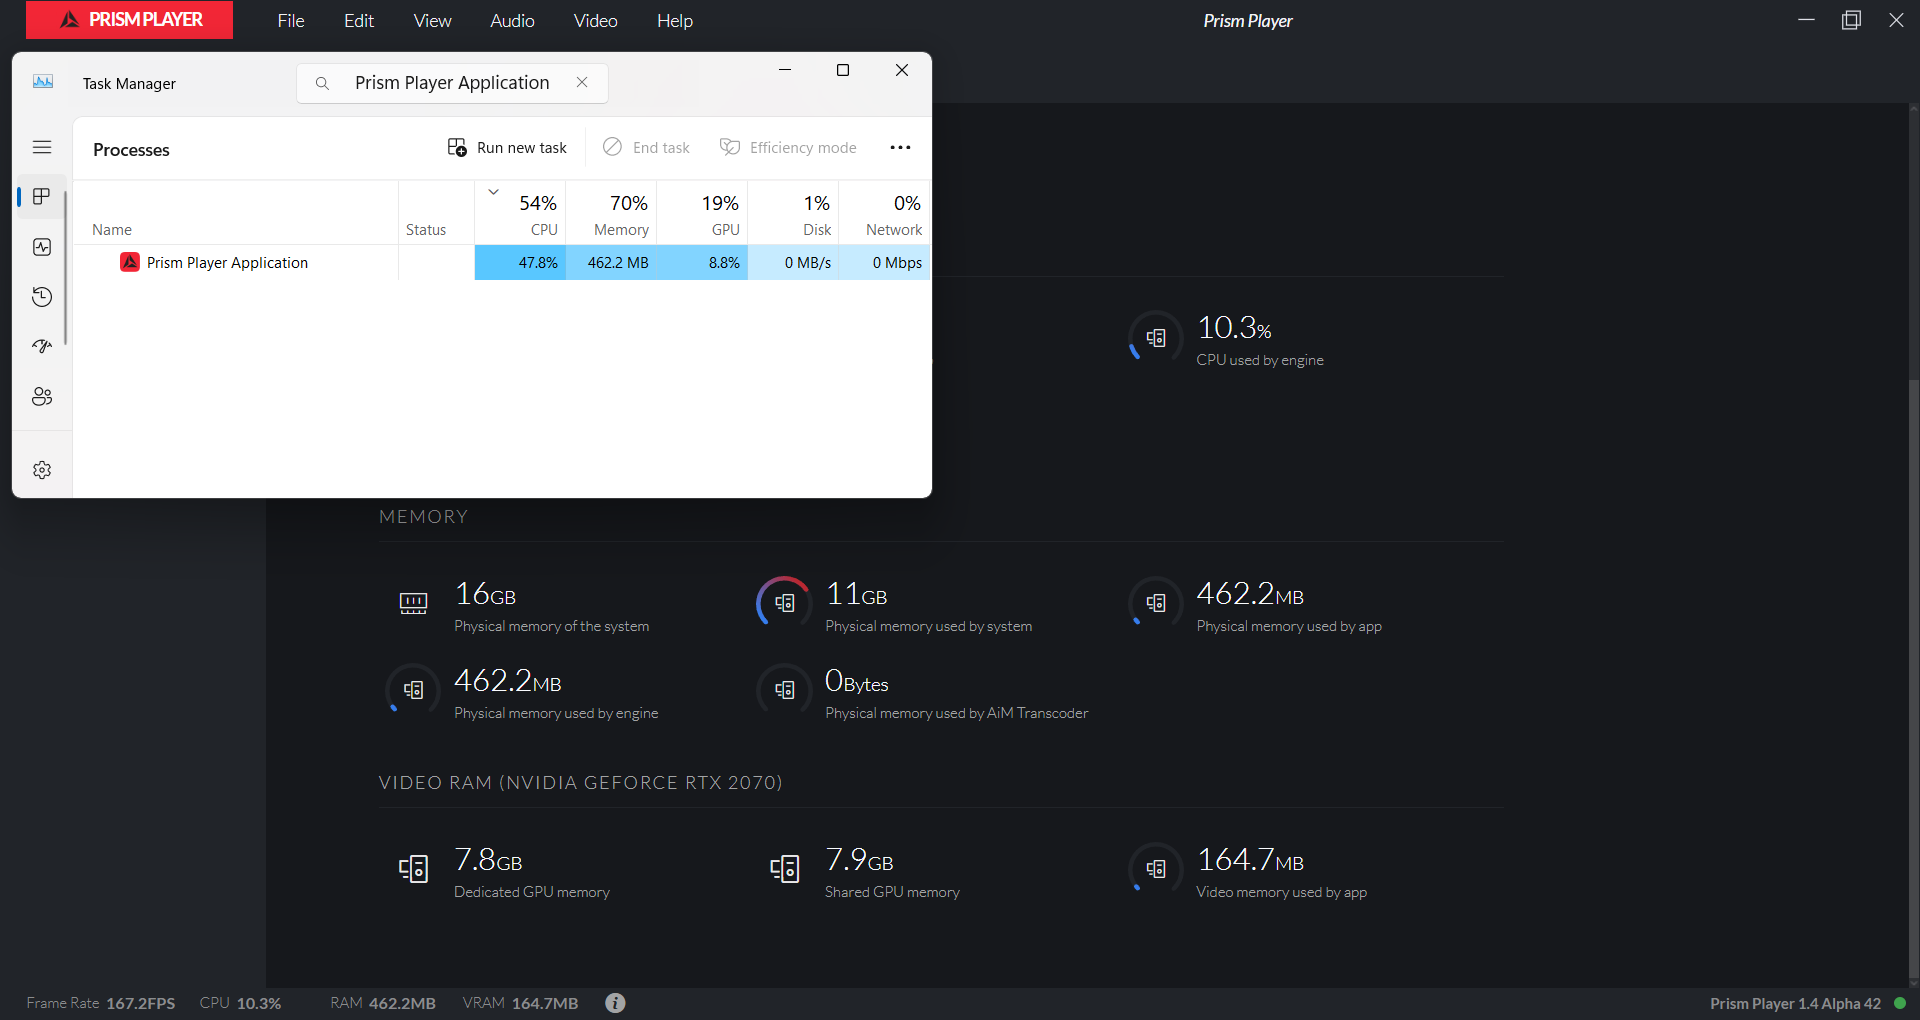
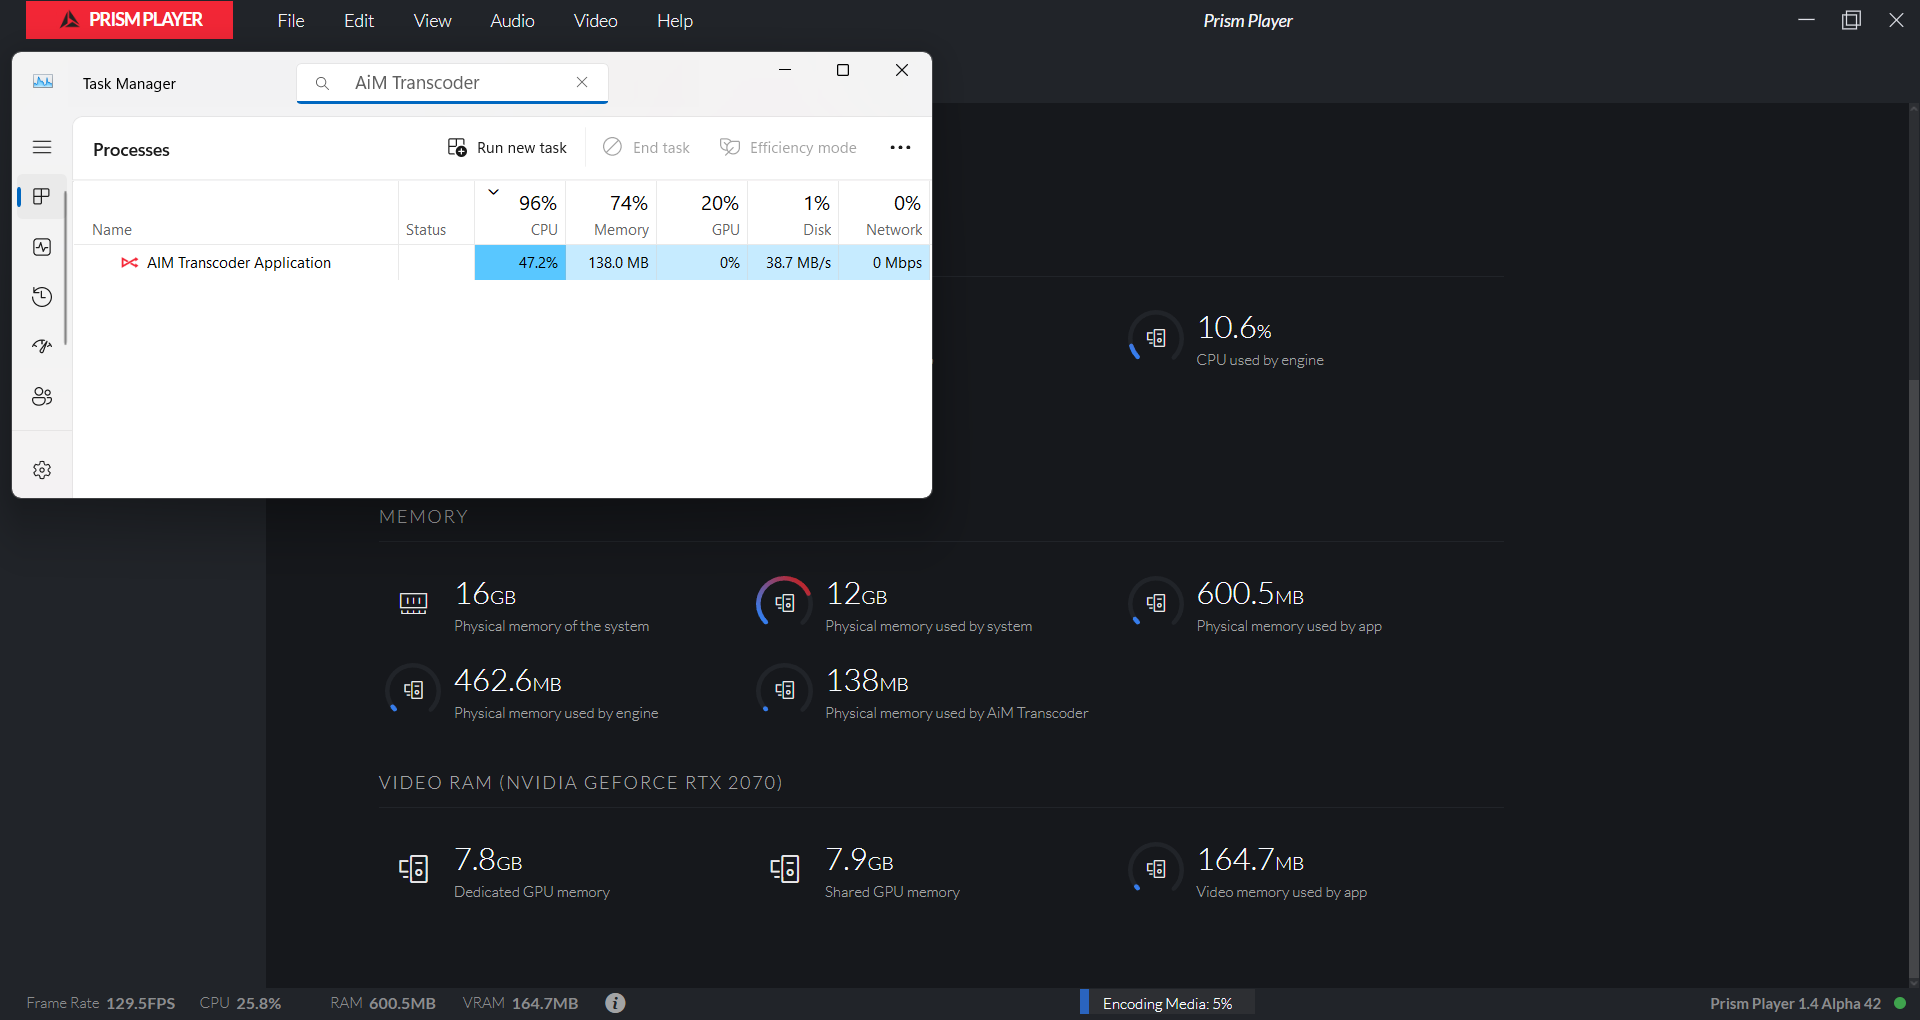
Per-process CPU load (engine process, AiM Transcoder process) is comparable to the value shown in Task Manager's Details tab under the correspondent process details - CPU column, in absolute %.
Alternatively, these values can be found in Resource Monitor's Processes tab under CPU column.
Memory
Per-process memory usage is comparable to the value shown in Task Manager's Processes tab under the correspondent process details - Memory column, in MB.